Electric vehicle adoption is accelerating, but charging infrastructure can struggle when demand rises suddenly. A busy station may appear efficient while its electrical system operates near its limit.
So, how can operators manage that pressure safely?
This guide explains How to prevent overloading in EV charging stations through practical planning, monitoring, and maintenance. It focuses on real conditions, including evening peaks, shared transformers, limited parking capacity, and uneven charging behavior. A station with ten chargers may not need ten vehicles charging at full power simultaneously. However, one unexpected demand spike can still trip breakers, overheat cables, or interrupt service.
Load management is central to reliable operation. Smart chargers can distribute available power according to vehicle demand, charging priority, and site capacity. Operators should also review transformer ratings, feeder capacity, protection settings, and ventilation conditions before expanding a station. Manufacturer instructions and applicable electrical codes remain essential references.
Small details matter. A dusty cabinet, loose connection, or damaged cable can create unnecessary resistance and heat. Routine inspections can reveal these problems before drivers notice repeated charging failures. Energy monitoring software can add another layer of evidence by showing hourly peaks and abnormal consumption.
There is no perfect formula.
A design that works at a quiet workplace may fail at a highway station during a holiday weekend. That limitation deserves attention. Experienced teams should test assumptions, record operating data, and adjust charging limits when real usage differs from the original plan. With disciplined engineering and transparent maintenance records, operators can protect equipment, improve uptime, and provide safer charging for every connected vehicle.
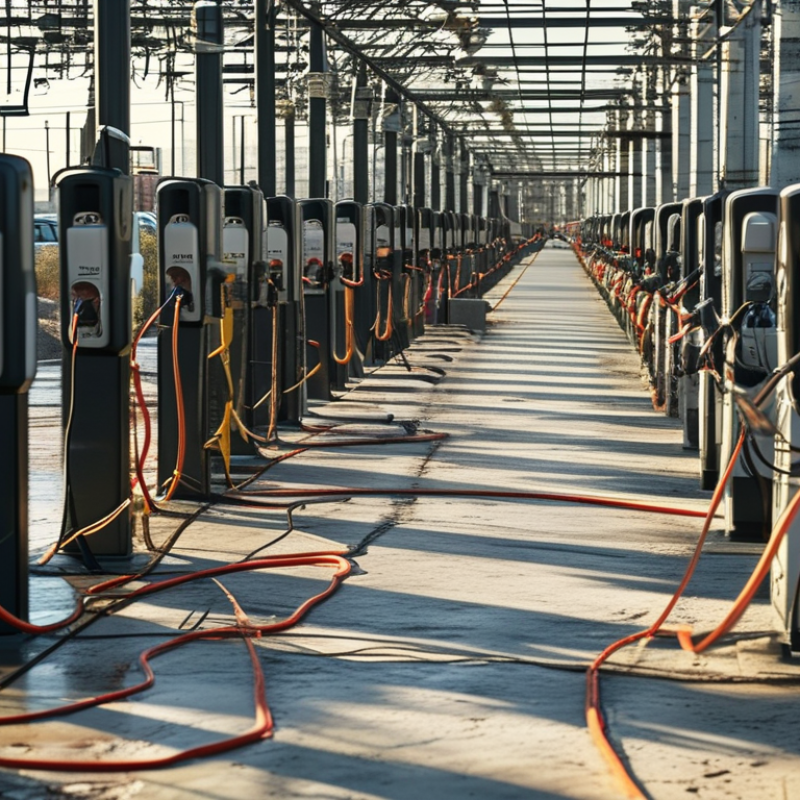
Measure Site Capacity: Compare 7.2 kW AC and 150 kW DC Charging Loads
How to Prevent EV Charging Station Overloading?
Measure Site Capacity: Compare 7.2 kW AC and 150 kW DC Charging Loads
Site capacity must be measured before selecting chargers. A 7.2 kW AC charger adds a steady, moderate load. One 150 kW DC charger can equal more than twenty 7.2 kW chargers. That gap matters.
For example, twelve AC chargers require 86.4 kW when operating simultaneously. Adding one DC charger raises charging demand to 236.4 kW. With an existing 80 kW building load, the site reaches 316.4 kW. A 300 kW service could overload.
The U.S. Department of Energy’s Alternative Fuels Data Center places Level 2 charging within a broad AC power range and identifies DC fast charging as a much higher-power category. Therefore, engineers should verify actual charger ratings, not rely on labels alone.
The International Energy Agency’s Global EV Outlook 2024 reports that public charging points exceeded four million worldwide in 2023. More installations make local load planning increasingly important.
Use interval meter data, transformer ratings, and utility demand records. Check the busiest fifteen-minute period, not only the monthly average. Dynamic load management can reduce charging power when the building approaches its limit.
A practical test might limit AC charging to 5 kW during peaks while preserving DC capacity for urgent sessions. This is not perfect. User behavior changes quickly. Conservative assumptions are safer than optimistic utilization forecasts. Test the control strategy under hot weather, full occupancy, and simultaneous vehicle arrivals.
Size EV Circuits as Continuous Loads Under NEC 625.41 and the 125% Rule
An EV charging station is not treated like an occasional household appliance. Under NEC 625.41, its load is considered continuous because charging may run for three hours or longer. That classification changes circuit sizing. A 32-amp EVSE, for example, requires a calculated load of 40 amps after applying the 125% rule. The branch-circuit conductors, overcurrent protection, and feeder capacity must support that demand under applicable NEC requirements.
Begin with the EVSE’s marked maximum output, not the vehicle’s average charging behavior. A 40-amp unit needs 50-amp circuit capacity when calculated at 125%. Check conductor ampacity, terminal temperature ratings, voltage drop, and the panel’s available capacity. A warm garage, long conduit run, or bundled conductors can affect practical performance. Small details matter.
I have seen installations pass a quick visual check but fail under repeated evening charging. That is easy to underestimate. The panel may appear adequate while several continuous loads operate together. Review the dwelling’s demand, service rating, and load calculation before installation. Follow the equipment instructions and confirm local inspection requirements. The 125% calculation is not a suggestion; it is a planning baseline. Still, field conditions can expose weaknesses that a worksheet misses. Practical verification remains necessary.
Coordinate Smart Charging Through OCPP 2.0.1 and ISO 15118 Load Controls
How to Prevent EV Charging Station Overloading?
Coordinate Smart Charging Through OCPP 2.0.1 and ISO 15118 Load Controls
EV charging demand is rising quickly. The IEA’s Global EV Outlook 2024 reported nearly 14 million electric car sales in 2023. It also recorded more than 4 million public charging points worldwide. A site designed for yesterday’s traffic can struggle when several vehicles arrive together.
OCPP 2.0.1 helps operators control this risk with charging profiles, power limits, and scheduled load distribution. The central system can reduce output during peak periods, then restore power when capacity returns. ISO 15118 adds vehicle-level communication. A compatible car can share charging needs and accept negotiated current limits. Together, these standards can prevent a 400-amp connection from becoming a 400-amp problem.
Start with the site’s real electrical capacity, not its advertised charger rating. Measure transformer loading, cable temperature, and local peak demand. Then set a safe total power ceiling in the charging management system. Give priority to emergency fleet vehicles or cars with low battery levels. Keep transaction logs for review.
Tips: Test one charging group during the busiest hour. Set a conservative limit first. Check whether each vehicle supports ISO 15118 features. Some do not. Manual fallback controls still matter.
A practical weakness remains: smart charging is not automatically intelligent. Poor meter data or delayed communication can create uneven charging. Regular firmware checks, simulated overload tests, and clear failure rules are essential. The system should fail safely, even when communication stops.
Apply Dynamic Load Balancing to Keep Aggregate Demand Within Transformer kVA
How to Prevent EV Charging Station Overloading?
Dynamic load balancing keeps the combined demand of EV chargers below the transformer’s available kVA. It measures site consumption continuously through current transformers or smart meters. The controller then adjusts charger output before demand reaches a dangerous threshold. A practical setting leaves a safety margin, often 10–15% below the transformer’s rated capacity. This margin allows for lighting, pumps, HVAC systems, and measurement delays.
At a busy charging site, six vehicles may request full power at the same moment. Instead of allowing every charger to draw maximum current, the system shares available capacity. Vehicles close to completion can receive less power. Emergency or operationally important chargers may receive higher priority. The controller should react quickly, but it should not make unstable, constant adjustments. A short response delay can prevent unnecessary power fluctuations.
Installation experience shows that accurate metering matters more than complicated software. Sensors must be placed at the correct electrical boundary and tested during real peak conditions. Commissioning should compare displayed demand with the transformer meter. Logs can reveal whether limits are too strict or too generous. In practice, the first configuration is rarely perfect. A conservative limit may frustrate drivers, while an aggressive limit can overheat equipment. Review seasonal demand, cable temperatures, and charging patterns regularly. Keep a manual fallback mode available if communication fails. During testing, technicians should verify that chargers reduce output before the transformer reaches its approved kVA limit.
How to Prevent EV Charging Station Overloading?
Apply dynamic load balancing to keep aggregate demand within transformer kVA.
This operating profile represents a 500 kVA transformer serving a mixed site load and twelve 22 kW AC EV chargers.
Without load balancing, coincident charging pushes the site above the transformer’s 500 kVA rating during the evening peak.
Dynamic load balancing continuously adjusts charger power so aggregate demand remains below the transformer limit while available capacity is used efficiently.
Monitor Current, Voltage, Temperature, and 15-Minute Peak Demand Data
EV charging overload usually begins quietly: a warm cable, a voltage dip, or a breaker that trips during evening arrivals. The International Energy Agency reported more than 14 million electric cars were sold globally in 2023, increasing pressure on local electrical networks. Operators should monitor current and voltage at the feeder, charger, and individual circuit. Current sensors reveal simultaneous charging, while voltage readings expose undersized conductors or unstable supply. A 5% voltage drop should trigger investigation, but every site needs engineering verification.
Temperature data adds a useful warning layer. Sensors near terminals, connectors, and distribution equipment can identify heat before insulation damage occurs. A rising temperature with steady current often indicates a loose connection or poor ventilation. The U.S. Department of Energy’s Alternative Fuels Data Center tracks rapid growth in public charging infrastructure, making thermal monitoring increasingly practical for busy sites. Small details matter.
Record demand in utility billing intervals, commonly 15 minutes. A site may appear safe when viewed hourly, yet several vehicles starting together can create a costly peak. The National Renewable Energy Laboratory has documented how managed charging can shift demand away from grid-constrained periods. Dynamic load control can pause or reduce selected sessions when current or peak demand approaches a configured limit. However, fixed thresholds are not enough. Weather, occupancy, and aging equipment change real conditions. I would review alarms monthly, because a perfectly designed rule can still miss an unusual Friday evening.
Conclusion
How to prevent overloading in EV charging stations begins with understanding the site’s available electrical capacity and comparing the demand of different chargers, such as 7.2 kW AC units and 150 kW DC systems. Each EV circuit should be designed as a continuous load, applying the 125% sizing rule under NEC 625.41 to provide an appropriate safety margin. This helps prevent excessive current, overheating, and nuisance protection trips during extended charging periods.
Effective load management is equally important. Smart charging controls based on OCPP 2.0.1 and ISO 15118 can coordinate charging schedules, power limits, and vehicle communication. Dynamic load balancing can then adjust charging output in real time so total demand remains within the transformer’s kVA rating. Continuous monitoring of current, voltage, temperature, and 15-minute peak demand data allows operators to identify abnormal conditions early, reduce demand spikes, and maintain reliable, efficient, and safe charging performance.

 Walnut Charger